
When two or three reflective events on an OTDR trace sit close together — connectors and splices packed into the same patch panel or enclosure, a metre or less apart — the instrument can struggle to show them as clean, separate peaks. One of them might be faulty. The question is which.
There’s a reliable technique for telling a genuinely faulty component from its well-behaved neighbours without needing to physically separate them: check the combined loss first, then read the combined return loss and compare how tall each reflective peak is. Here’s how it works, with a worked example.
Why closely-spaced events are hard to read
An OTDR is an excellent tool for measuring the loss and return loss of optical components — but it can struggle where events sit close together on the trace. Take three reflective events spaced just 1 metre apart, a fairly typical layout for several connectors or splices crowded into one enclosure. The OTDR’s resolution isn’t enough to cleanly separate three peaks that close together into three individual readings. Rather than needing to physically isolate each one, the operator can use two of the OTDR’s own facilities — loss and return loss — together with a couple of simple techniques, to work out which component (if any) is the problem.
The two-step method: loss, then return loss
Step 1: check the combined loss
Start with the overall loss across the group of events. If each of the three is expected to be a good connector at around 0.1dB, the combined loss should come out close to 0.1dB + 0.1dB + 0.1dB = 0.3dB. If the actual measured loss across the group is much higher than that, something in it is faulty — but the loss figure on its own can’t tell you which one.
Step 2: use return loss to find the culprit
That’s where return loss comes in. Measure the combined return loss of the same group using the OTDR’s return loss facility, and look at the relative height of each reflective peak. Assume a properly working component has an individual return loss of 40dB, and a component with an air gap in it reads 14.5dB.
Worked example: three events, four scenarios
Using the same three reflective events, 1 metre apart, here’s how the combined return loss — and what you’d see on the trace — changes depending on how many of the three have failed with an air gap:
| Scenario | Components with an air gap (14.5dB) | Combined return loss | What the peaks show |
|---|---|---|---|
| One faulty component | 1 of 3 | 14.47dB | The faulty component’s peak clearly stands out as the tallest of the three. |
| Two faulty components | 2 of 3 | 11.5dB | Both faulty peaks stand out; the one good component reads comparatively low. |
| All three faulty | 3 of 3 | 9.7dB | All three peaks are high and roughly even — no single peak stands out, because none of them is good. |
| All three good (baseline) | 0 of 3 | 35.23dB | No peak stands out above the others — this is what a healthy group looks like. |
Combined return loss is the power-sum of the three individual reflections, not a plain addition of the dB figures.
When the loss is bad but return loss looks fine
| Loss | Return loss | What it means |
|---|---|---|
| Good | Good, as expected | The system passes — the group is fine. |
| Not good | Good | There’s a faulty component in the group, but loss and return loss alone can’t tell you which one. |
In that second case, two further techniques can narrow it down. Test at both 1310nm and 1550nm — a bend in the fibre typically shows up as extra loss specifically at 1550nm, higher than you’d otherwise expect. Or put a tight bend in the fibre between the events: this eliminates reflections from anything beyond the bend, letting you read the individual return loss of each event on its own rather than as a combined figure.
Reading the trace: separated vs. overlapping peaks
How you read the trace depends on whether the OTDR can show the events as distinguishable peaks at all:
Read the return loss (peak height) and the loss (step down in the trace level) separately for each labelled event — here B is the clear outlier.
Even when the events blur together into one feature on the trace, the peak of the problem event still shows up higher than the rest.
Schematic — illustrates relative peak height only, not measured data.
Opticus OTDR equipment
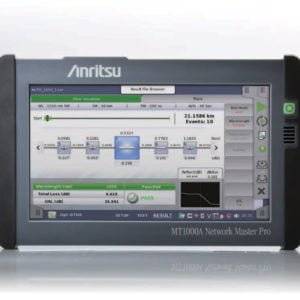
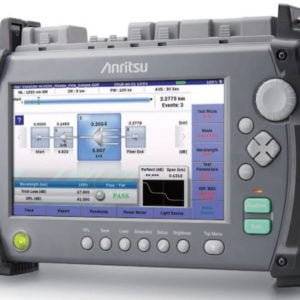
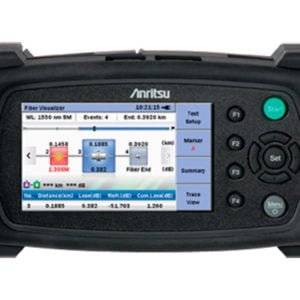
Reading loss and return loss together, the way this note describes, relies on the return loss facility built into a proper OTDR. Our range runs from a compact micro OTDR up to a high-resolution long-distance unit:



For working through traces in detail afterward
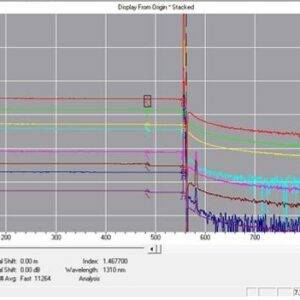
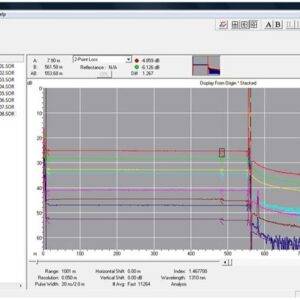
Our OTDR reporting software makes it easier to annotate and compare peaks like these once you’re back at a desk, rather than reading them off the instrument’s own screen:
Fibre Masterclass Note 75 — for printing or offline reference
Not sure what’s in your own trace?
Tell us what you’re seeing and we’ll help you work out what it means.